Editor’s note: We asked columnist Tom Bouthillet to pick a winner to this month’s challenge and he wrote: “There were two outstanding diagnoses this month, so my pick for the winners of the June 2011 EMS 12-lead column are Becky Murphy and Heather Montalbano, whose answers can be seen in the comment block.
Haven’t read the initial case presentation? Read: ECG Challenge: The Right Stuff
Let’s take another look at the patient’s ECGs.
This rhythm strip shows atrial pacing at a rate of 60.
Although pacing spikes are not visible in the 12-lead ECG, based on the fact that the rate is still exactly 60, there’s a good chance that atrial pacing is still present.
Generally speaking, a ventricular paced rhythm will show left bundle branch (LBBB) morphology in lead V1.
This ECG shows right bundle branch block (RBBB) morphology in lead V1 suggesting that the patient has a preexisting RBBB.
A left axis deviation is present (positive QRS complexes in lead I and negative QRS complexes in leads II and III). In other words, the ECG shows bifascicular morphology (right bundle branch block and left anterior fascicular block). However, this could be normal for this patient! She does have a pacemaker, after all.
There’s something else about this ECG that’s truly alarming! Do you see it? I’m talking about acute STEMI! If you look carefully at leads V1 and V2 and you will see Q-waves and ST-elevation.
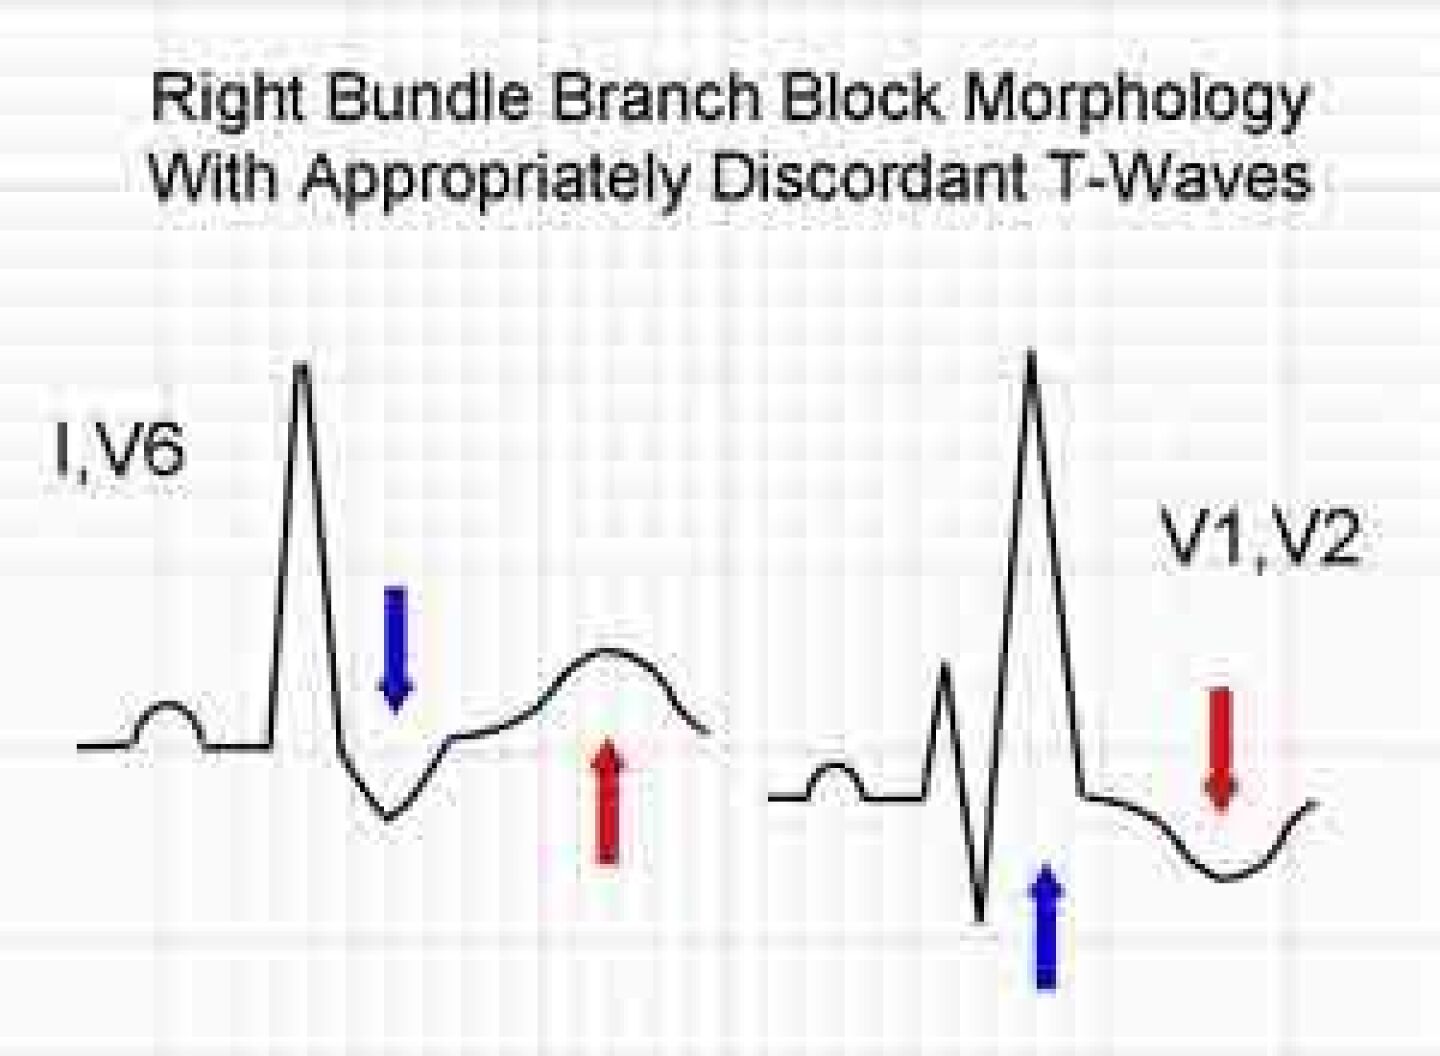
RBBB does not distort the ST-segment in the same manner as LBBB so it usually does not confound the diagnosis of acute STEMI. However, a good understanding of the expected relationship between the QRS complex and T-wave in RBBB can help you spot abnormalities a lot faster.
Consider the following graphic.
With RBBB, when the terminal (last) wave of the QRS complex is negative, the T-wave should be positive. Conversely, when the terminal wave of the QRS complex is positive, the T-wave should be negative.
If you look at lead V2 the ST-segments and T-waves are concordant (in the same direction as) the terminal deflection of the QRS complex. That’s bad!
In lead V1 even though the T-waves are appropriately discordant (opposite the terminal deflection of the QRS complex) the ST-segments are concordant with the terminal deflection. That is also bad!
Throw in the Q-waves in leads V1 and V2 and the diagnosis of acute STEMI is clinched!
You might also notice that the T-waves are concordant with the terminal deflection in the high lateral leads I and aVL and the inferior leads III and aVF. This is all likely due to the acute STEMI (with the concordant T-waves in leads III and aVF representing reciprocal changes).
A “STEMI Alert” was called from the field and the patient was taken to the cardiac cath lab where the diagnosis was confirmed with angiography.
Let’s consider another example of acute STEMI in the presence of right bundle branch block.
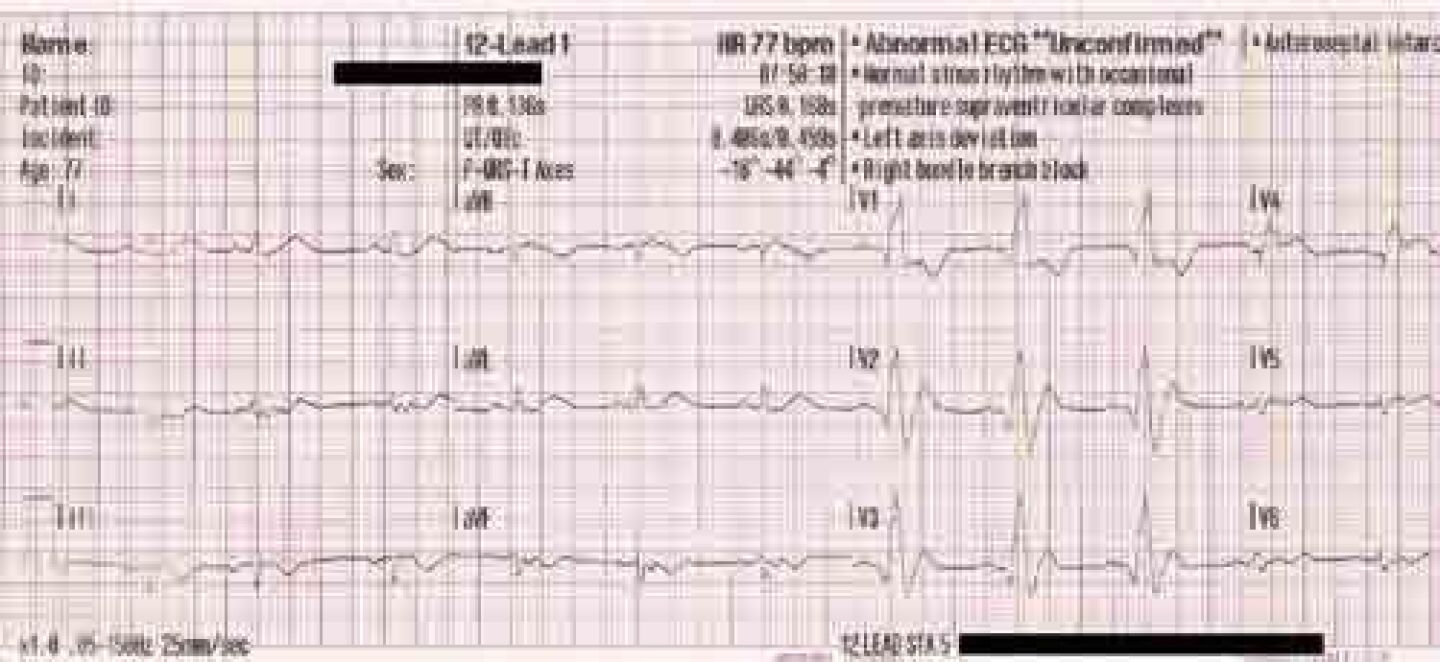
This is a supraventricular rhythm. The QRS complexes are “wide” at 168 ms and RBBB morphology is present in lead V1. Do you see any T-waves that are concordant with the terminal deflection of the QRS complex?
How about lead V4?
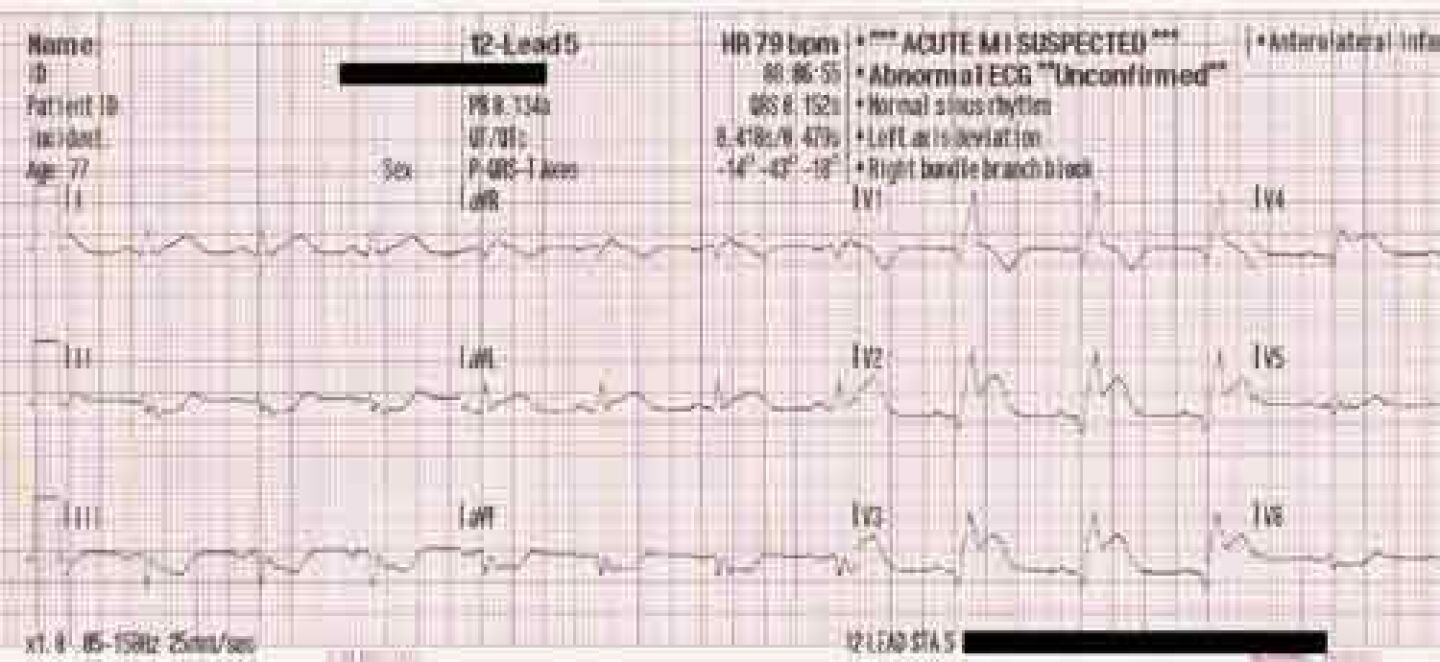
Now look at the same patient’s ECG on arrival at the hospital about 17 minutes later.
Remember, the dynamic supply vs. demand characteristics of ACS almost always lead to changes on serially obtained ECGs! One of my favorite quotes about 12-lead ECGs came from Tim Phalen who compared obtaining only one 12-lead ECG to taking a single photograph of Old Faithful. He said, “Maybe it’s a geyser; maybe it’s a hole in the ground.”
Just like we should always take more than one set of vital signs to look for trends, we should obtain serial ECGs to look for changes!


